When you put a sensor out in a real field instead of a controlled lab, you inherit all the messiness of the real world along with it. Sun, wind, rain, dust, and one factor that’s easy to overlook because it seems so ordinary: temperature. It turns out temperature alone can quietly distort a sensor’s readings, and if you don’t account for it, you can end up mistaking the weather’s influence on your equipment for something happening in the plant.
This is a less exciting part of the dendrometer study I worked on, but it’s one of the most important, because it’s the kind of quiet, careful work that determines whether the rest of the data can actually be trusted.
Why Temperature Affects a Sensor at All
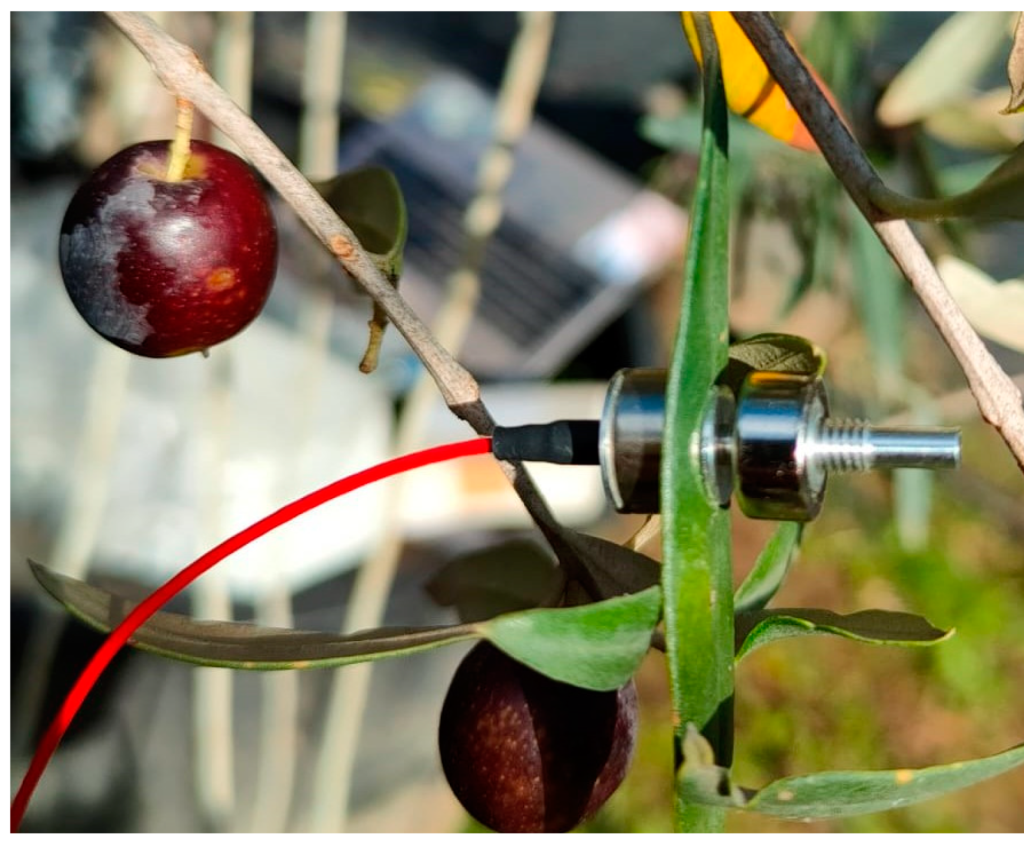
The dendrometer we tested measures thickness using strain gauges, small components that respond to tiny mechanical deformations in a flexible metal band. That’s exactly what you want when a stem or a piece of fruit is genuinely changing size. But metal itself also expands and contracts slightly with temperature, completely independent of anything happening in the plant. A sensor housing sitting in the sun on a 30°C afternoon isn’t the same physical size as it was at dawn, even if nothing about the plant tissue has changed at all.
If that effect isn’t accounted for, you risk reading a temperature swing as if it were a plant-water swing, which would badly muddy the very signal you’re trying to capture.
How We Measured the Effect Directly
To isolate exactly how much temperature alone was influencing the readings, we ran a clean test using a piece of Invar metal, a material specifically chosen because it has an unusually low rate of thermal expansion, making it about as close to a “stationary target” as you can get. If the sensor showed changes in a reading on this material, we knew it had to be from temperature, not from any real change in size.
We recorded temperature and sensor output together and found a clear, statistically strong relationship between the two: for every degree Celsius of temperature change, the sensor’s apparent reading shifted by about 2.96 micrometers. On a typical day with a 21°C swing between the coolest and warmest hours, that added up to an apparent change of about 62 micrometers, even though the Invar target hadn’t actually changed size at all.
To put that in perspective against the plant data itself: stem diameter in the study varied by about 0.7 millimeters over a full day. An uncorrected temperature effect could account for up to roughly 10% of that range, a real, meaningful chunk of the signal, if left uncorrected.
Building the Fix Into the Data
Once we knew the exact relationship between temperature and sensor drift, we could correct for it directly. Using that relationship, every reading collected in the field could be adjusted to reflect what the sensor would have shown at a constant reference temperature, effectively subtracting out the weather’s influence on the equipment itself and leaving behind a cleaner signal of what the plant was actually doing.
This is exactly what allowed us to trust the diurnal shrink-and-swell patterns we saw in stems, and the steady growth we tracked in fruit, as real biological signals rather than partly an artifact of a warm afternoon.
Why This Kind of Detail Matters
It would have been easy to skip this step, to assume the sensor was accurate enough as-is and move straight to reporting the interesting plant patterns. But skipping it would have meant reporting numbers that were quietly contaminated by something that had nothing to do with the plant at all.
This is really what separates a trustworthy field measurement from an unreliable one: not just having a sensitive sensor, but understanding every factor that could influence its readings, measuring that influence directly, and correcting for it before drawing any conclusions. It’s not the most exciting part of building a monitoring tool, but it’s often the part that determines whether the rest of the data means anything at all.
The Bigger Point
Anyone relying on field sensors, whether for research or for making real decisions about irrigation and crop management, should care about this kind of rigor, even when it’s invisible in the final result. A reading that looks clean and sensible on a chart isn’t automatically trustworthy. It’s trustworthy because someone went to the trouble of checking what else, besides the plant, might be quietly influencing that number, and made sure it got accounted for.
Based on: Link, S.O., Thiede, M.E., van Bavel, M.G. “An Improved Strain-Gauge Device for Continuous Field Measurement of Stem and Fruit Diameter.” Journal of Experimental Botany, Vol. 49, No. 326, pp. 1583-1587, 1998. View the full paper here / Download the paper here